A growing number of homes across the United States feature more bedrooms than the average household needs, contributing to a rise in the number of “excess bedrooms” in the housing market. In this report, we examine trends in guest bedrooms (which we refer to as “excess”) over time and across the 100 largest metropolitan areas.
More specifically, we define a home as having an excess bedroom if the number of bedrooms minus the number of persons minus one is greater than zero. (Minus one accounts for the possibility of a home office.) Our key findings are below.
Key findings
- The number of “excess bedrooms” in the U.S. reached a record high in 2023.
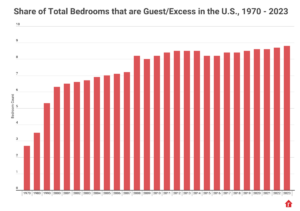
- The share of total bedrooms that could be considered excess also reached a record high last year.
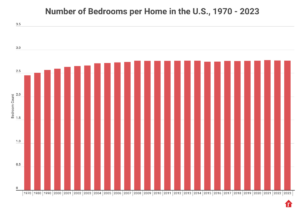
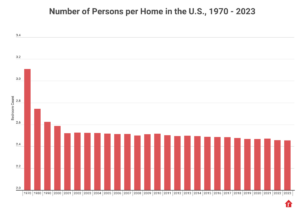
- Much of the trend in the increasing number of excess bedrooms is being driven by both declining household sizes and an increase in the number of bedrooms per home.
- The trend of excess bedrooms is most pronounced in the Mountain West and South and less in the Northeast and West.
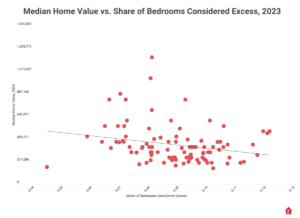
- There is a loose correlation between the share of excess bedrooms in a market and median home value.
Nationally, the number of guest bedrooms—which we define as a bedroom that is in excess of the number of persons in the home plus one (to account for an office)—reached the highest levels in census record history. In 2023, that number reached 31.9 million extra bedrooms in the U.S., up from 31.3 million the year prior and over four times the 7 million in 1980.
What’s more, even though the U.S. housing stock is as large as it has ever been, we still find that the share of all bedrooms that could be considered “extra” has also reached record highs, at 8.8%. This is up from the 8.7% in the year prior and over twice the 3.5% rate in 1980.
The record-high number and share of excess bedrooms in the U.S. are driven by both an increase in the number of bedrooms per home and a decline in the number of persons per household. While we have seen an increase in the average number of bedrooms per home over the past 50 years, growing from an average of 2.5 rooms in 1970 to 2.8 in 2023, there has been no change over the past 10 years when the average was also 2.8 rooms per home in 2013. The more significant factor is a declining number of persons per household, falling from a high of 3.1 persons per household in 1970 to a record low of 2.5 persons per household in 2023.
The trend of excess bedrooms is most pronounced in the Mountain West and South, where land is plentiful and homes are often built with more square footage and larger floor plans. In contrast, homes in densely populated urban areas where land is scarcer tend to have fewer extra bedrooms, reflecting the higher demand for space-efficient living and affordability.
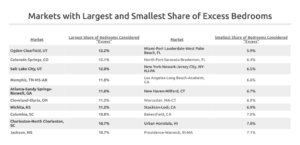
The top five markets with the share of total bedrooms that could be considered excess are Ogden, UT (12.2%), Colorado Springs, CO (12.1%), Salt Lake City, UT (12%), Memphis, TN (11.8%), and Atlanta, GA (11.6%). The five markets with the lowest share include Miami, FL (5.9%), Sarasota, FL (6.4%), New York City, NY (6.5%), Los Angeles, CA (6.6%), and New Haven, CT (6.7%).
Last, we find a loose but noticeable correlation across the 100 largest markets between the median home value in a market and the share of total bedrooms in a market that could be considered excess. This makes some intuitive sense: All things being equal, it is likely easier for households to afford an extra bedroom in cheaper places than more expensive ones. For example, a typical two-person household probably has a better chance of being able to afford a four-bedroom home in Ogden than in New York City.
Methodology
For this analysis, we gathered data on household inhabitants and bedrooms from the US American Community Survey (ACS) nationally and for the 100 largest metro areas between 1970 and 2023. From there, we calculated the number of available bedrooms as the (total number of bedrooms) – (the number of household members) – 1. We subtract 1 additional bedroom to account for various uses, such as an office or storage space. We compared the resulting count of homes with spare bedrooms to the total number of owner-occupied households within the metro to come up with our metric for the share of homes with unoccupied bedrooms. We estimated home values using the self-reported value of owner-occupiers in the ACS.


