What happened this quarter
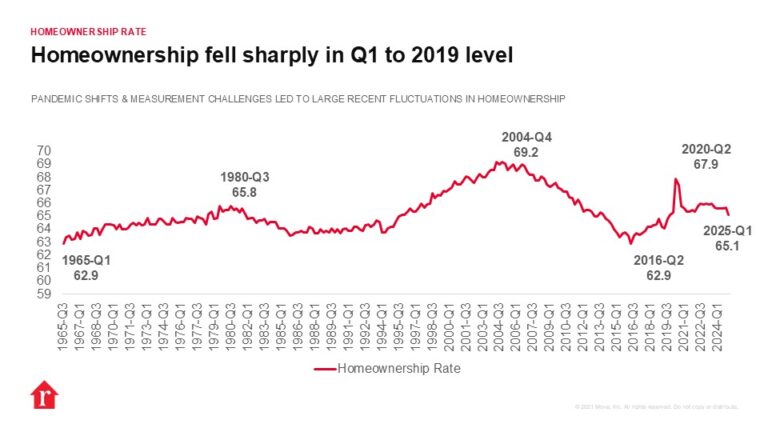
The homeownership rate in the United States fell to 65.1% in the first quarter of 2025, 0.6 percentage points below the fourth quarter of 2024 and 0.5 percentage points below one year ago. This quarter’s homeownership rate is the lowest since Q4 of 2019. The homeownership rate spiked in early 2020 before settling in the mid 65% – 66% range through the pandemic and the years following. The quarter’s dip is likely due to ongoing housing affordability challenges and a lack of affordable housing options. Though inventory levels continue to rise on an annual basis, the number of homes for sale is still below pre-pandemic levels, which has kept upward pressure on home prices and limited affordable options for many households.
The homeowner vacancy rate held steady at 1.1% in Q1, the same as the previous quarter and 0.3 percentage points higher than a year prior. Homeowner vacancy remained below 1% from Q1 of 2022 through Q3 of 2024, emphasizing the lack of for-sale inventory. Though recent inventory gains have kept vacancy at a recent high, there are still far fewer vacant homes than was typical in the years pre-pandemic, suggesting that inventory still has some ground to cover.
The rental vacancy rate increased to 7.1% in Q1, the figures highest level since the third quarter of 2018. The rate was 0.2 percentage points higher than the previous quarter and 0.5 percentage points higher than one year prior. The loosening rental market is good news for renters, taking some pressure off of rents, which have remained near record-highs in much of the country. Interestingly, rental vacancy within principal cities is even higher at 7.5%, while suburbs lag the national level at 6.8% and areas outside of metros saw a rental vacancy of 6.4%.
Rental vacancy varies regionally as well, with the South (8.6%) seeing the highest vacancy, followed by the Midwest (7.6%), the West (5.9%) and the Northeast (5.1%). All four regions saw rental vacancy climb annually. Homeowner vacancy follows a similar trend, with the South (1.3%) leading, followed by the West (1.1%), the Midwest (0.9%) and the Northeast (0.6%). Only the Northeast saw a falling vacancy rate year-over-year.
The South has seen inventory climb over the last couple of years due to a boom in construction activity during the pandemic, which is continuing to trickle through in single- and multi-family completions. Generally, states in the South and West have done well to keep up with demand via new construction. The South and the Midwest have performed well in terms of affordability. The Northeast has performed the worst in terms of both new construction activity and affordability.
Different outcomes by race/ethnicity
Homeownership rates by race and ethnicity were relatively steady year-over-year, coming in at 74.2% for Whites (+0.2 percentage pts YY), 44.7% for Blacks (-1.0 ppts YY), 47.8% for Hispanics (-2.1 ppts YY), 62.0% for Asians, Native Hawaiians, and Other Pacific Islanders (-0.2 ppts YY), and 57.2% for all other races (-0.3 ppts YY) in the first quarter of 2025. Though these numbers have been quite stable recently, homeownership fell for all groups quarter-over-quarter.
Different outcomes by age
Homeownership rates by age showed downward movement for younger groups this quarter as buyers contend with challenging market conditions. Homeownership among those under 35 years old was 36.6% (-1.1 percentage pts YY), among those 35 to 44 years old is 60.3% (-1.1 ppts YY), 45 to 54 years old is 70.6% (-0.2 ppts YY), 55 to 64 years old is 75.2% (-1.1 ppts YY), and 65 and older is 79.0% (+0.3 ppts YY). The large jump between the first two categories supports the recent data showing that the typical age of first-time homebuyers is 38. Younger home shoppers face affordability headwinds as the homeownership rate for age 35 and under fell to the lowest level since pre-pandemic.


