What happened this quarter
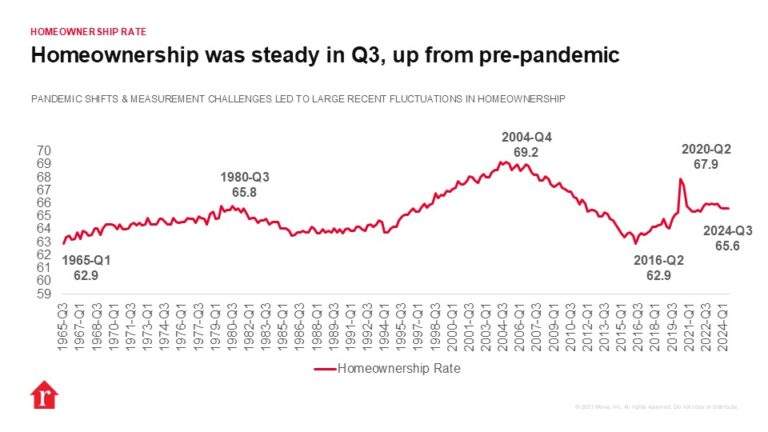
The homeownership rate in the United States held steady in the third quarter of 2024 at 65.6%, the same percentage as last quarter and only marginally lower than the third quarter of last year at 66.0%. Homeownership peaked in the fourth quarter of 2004 at 69.2% and then gradually decreased until bottoming out in the second quarter of 2016. It then steadily grew for four years until spiking to 67.9% in the second quarter of 2020 amid the pandemic. Since the fourth quarter of 2020, the homeownership rate has hovered between 65.4% and 66.0%, a significantly lower rate than before the Great Recession. With housing inventory back to early 2020 levels, first-time homebuyers should have plenty of options, but they continue to face the challenges of affordability as listings prices have remained stubbornly high and mortgage rates have swung back up above 6.7%.
The homeowner vacancy rate ticked up slightly, to 1.0% compared to 0.9% in Q2 and 0.8% in 2023Q3. Homeowner vacancy has been on a consistent decline since 2011 and has stayed at or below 1.0% since 2020Q2, even as for-sale inventory has grown post-pandemic.
The rental vacancy rate grew as well, to 6.9%, the highest since 2019Q1. A higher vacancy rate will further strengthen the current trends of 14 consecutive months of year-over-year decline in the median asking rent and 9 straight months of year-over-year decline in multifamily construction starts.The rental vacancy rate is higher in principal cities (7.2%) than it is in suburban areas (6.7%), where rentals are less plentiful. The rental vacancy rate is highest for the South region, at 8.5%, compared to 6.9% for the Midwest, 5.7% for the West, and 5.4% for the Northeast. 8 of the top 10 metropolitan areas where rents have fallen the fastest are in the South, and even though the region’s single-family construction starts are up 1.9% year-over-year, the total number of housing units being started is down 6.6% there. Midsized to large Southern metros like Nashville, DFW, and Austin are experiencing a supply glut, with much of the excess newly-built, and make for attractive destinations for renters.
Different outcomes by race/ethnicity
Homeownership rates by race and ethnicity were essentially unchanged year-over-year, coming in at 74.2% for Whites, 45.7% for Blacks, 48.8% for Hispanics, 62.5% for Asians, Native Hawaiians, and Other Pacific Islanders, and 57.7% for all other races in the third quarter of 2024. Though these numbers have been quite stable recently, when compared with the third quarter of 2020, the Asian, Native Hawaiian, and Other Pacific Islander segment has grown a bit, from 61.0%, while all other race categories have seen homeownership fall over the same period.
Different outcomes by income
Homeownership rates by income were also unchanged from the third quarter of 2023, with the measure for households earning the national median income or higher at 78.5% and households earning less than the national median income at 52.7%. The overall homeownership rate has fallen from 67.4% in the third quarter of 2020 to 65.6% in the third quarter of 2024, and this decline appears to be relatively equally divided between high and low earners, with households at or above the median income seeing homeownership drop 1.7 percentage points and households below the median income seeing homeownership drop 2.0 percentage points.
Different outcomes by age
Homeownership rates by age, unsurprisingly, increase with each older category. Homeownership among those under 35 years old is 37.0%, among those 35 to 44 years old is 62.3%, 45 to 54 years old is 69.7%, 55 to 64 years old is 75.9%, and 65 and older is 79.1%. The large jump between the first two categories shows that the prime age range for first-time homebuying is 35 to 44, and younger potential buyers are currently facing even more affordability headwinds as the homeownership rate for age 35 and under fell by 1.3 percentage points year-over-year and 3.2 percentage points from 2020Q3.


