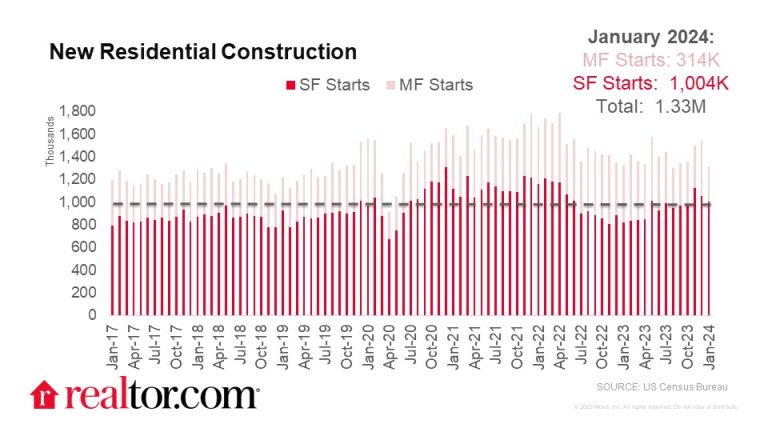
January 2024 New Residential Construction
What Happened:
New residential construction activity tumbled 14.8% month-over-month in January, falling from December’s upwardly revised estimate to 1,331,000 starts. Builders started 0.7% fewer homes than one year earlier, marking a slowdown in new construction despite rising builder sentiment. The month’s drop was largely due to a 35.8% decrease in multi-family starts compared to December 2023, a 37.9% decline year-over-year. Meanwhile, though single-family starts fell 4.7% month-over-month, the level was 22.0% higher than the previous January. Homebuilder sentiment climbed for the 3rd month in February to an index of 48– the highest level since Aug 2023. Though both single-and multi-family construction slowed on a monthly basis, this month’s data demonstrates a pivot from starting rental supply to starting single-family homes.
Mortgage rates remained fairly stable around 6.6% through the month of January, which kept buyer demand steady after December’s falling rates fueled activity. The latest inflation and employment data came in higher than expected as the economy remains resilient despite the elevated cost of borrowing. Shelter inflation remains the largest source of price growth, fueled by sustained buyer and renter demand, met with low inventory.
What Do Housing Permit Trends Tell Us:
Housing permits fell 1.5% month-over-month but remained 8.6% higher year-over-year in January. Similar to housing starts, the month’s overall drop was due to a 9% decline in large (5+ unit) multifamily starts (-26.6% year-over-year). However, single family permits picked up 1.6% month over month and 35.7% year-over-year, crossing the 1 million mark with 1,015,000 single-family permits. Overall permitting activity picked up in the Northeast (+19.4%), Midwest (+6.6%) and West (+1.5%), but fell in the South (-7.0%). Single family permits picked up in the Northeast (+13.7%), the South (+1.2%) and the West (+1.8%), but fell in the Midwest (-1.6%). Both overall permits and single family permits climbed year-over-year in all four regions. Climbing permitting activity suggests that builders are preparing for upcoming demand, which likely hinges on lower mortgage rates.
What Do Completions Mean for Housing Supply:
Home completions fell 8.1% month-over-month but remained 2.8% higher than one year prior. Single-family completions fell 16.3% month-over-month and 15.8% year-over-year while multi-family completions climbed 6.2% from December and 53.7% from the previous January, suggesting that more rental supply is near. As the uptick in multi-family construction works its way through the pipeline, increasing rental supply, rental vacancy has climbed to 6.6%, indicating a more balanced rental market. Rents eased on an annual basis for the majority of 2023, but remained near the 2022 peak. Renters will be eager to see increased rental supply soften rents further, as many have not yet felt much relief.
What Does this Mean for Homebuyers, Sellers, Homeowners, and the Housing Market:
New listing activity picked up 9.5% this week, bringing active inventory 13.9% higher. Though buyers are seeing more for-sale inventory, sustained demand means prices are holding relatively steady on an annual basis. An uptick in new construction supply may help relieve some upward pressure on prices as we head into the spring, a season when buyer activity ramps up. Based on the latest Fannie Mae Housing Survey, buyers are feeling optimistic about mortgage rates falling this year. An all-time survey high 36% of respondents expect mortgage rates to fall over the next 12 months. Based on permitting data, builders are also looking towards the future of the housing market with some optimism, preparing to bring supply to a still-undersupplied market as pent-up buyer demand awaits more affordable housing.


